Cesium Labels

By Dmitry Kiselev
May 24, 2023
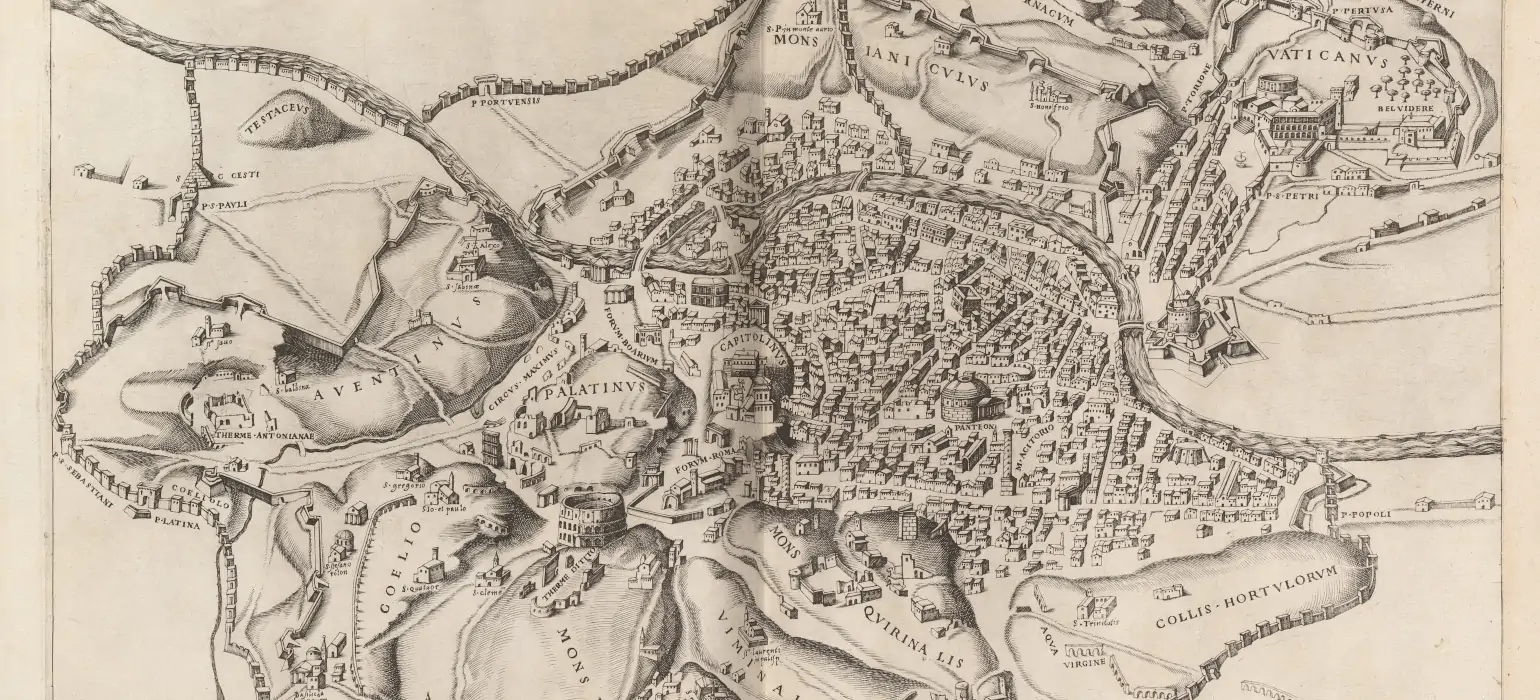
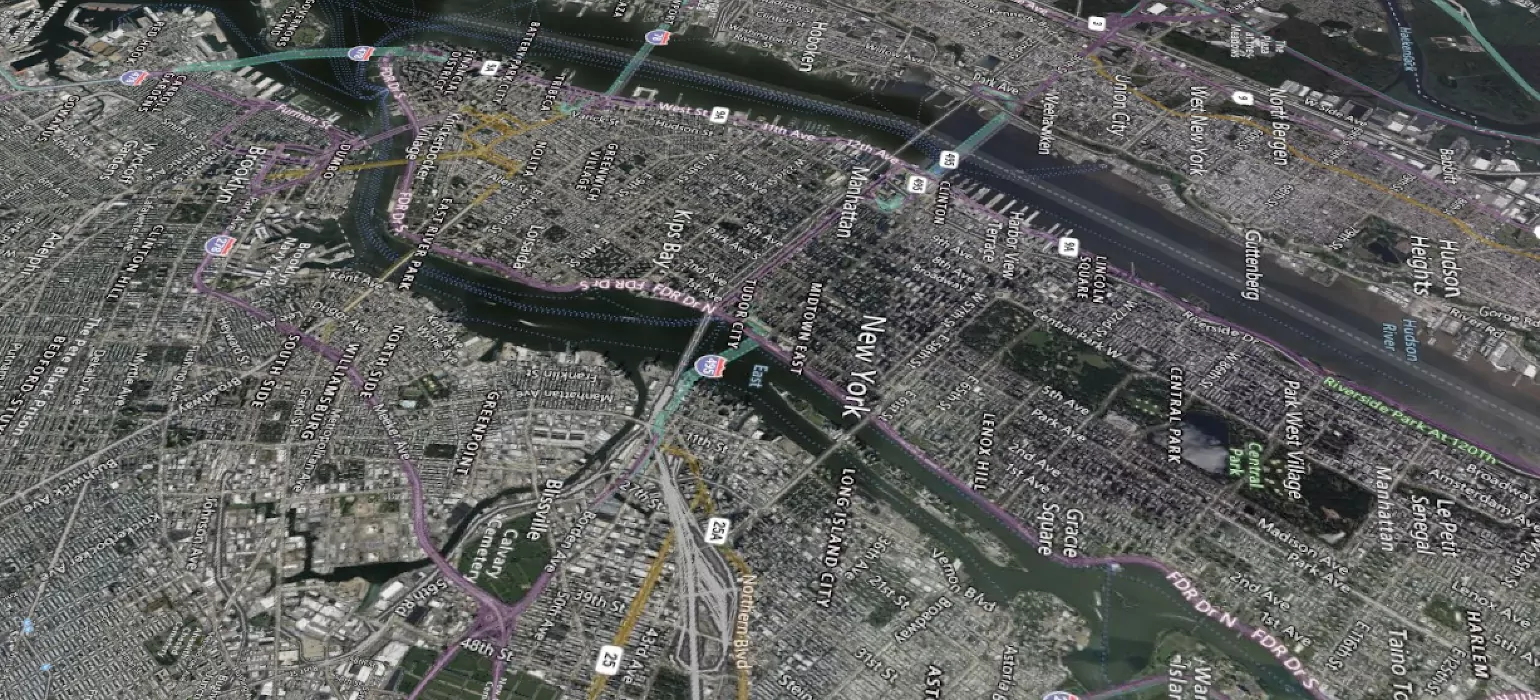
Improving place labels in CesiumJS, the open source JavaScript library for 3D globes and maps, has been a longstanding request from some of our VisionPort clients. The display of labels embedded in imagery has not been up to their expectations. The names look upside down as the globe is rotated and there’s no option to change the language:
Cesium has vector labels which allow you to anchor some text to a point on a map which will always be aligned with the camera. However, there is no ready-to-use solution to display city names in particular and no way to load them according to a specific zoom level.
To improve performance when displaying labels in Cesium it would make sense to load labels as a tile tree and only show some of the top of the tree at different zoom levels in a manner similar to how KML Regions with NetworkLinks work. Unfortunately, although Cesium supports KML, it doesn’t support KML Regions and NetworkLinks updates on Region change.
Another off-the-shelf solution that might conceivably work would be to use Cesium 3D tiles, but unfortunately, tiles do not support 2D Billboards.
Calculating regions and their level of detail is complicated, but Cesium already does most of that work for us. Cesium already calculates visible tiles and their corresponding levels of detail for ImageryProviders. An ImageryProvider is supposed to load imagery for a given tile’s coordinates and zoom level, which is almost what we want, except that we want to render some 3D primitives for labels, not 2D images for the earth surface.
We can read what tiles are going to be rendered by Cesium and store them in a variable:
const tilesToRender = viewer.scene.globe._surface._tilesToRender;
Then, we get the TMS coordinates out of the visible tiles on screen. Then we calculate the difference between the currently visible tiles and the new ones. We grab all the new tiles that we need from that list, and then we create the Entities with labels and some other styling properties.
Backend and data source
To source the labels we use GeoNames. They have a nice dataset for cities with their population included in the data. We take the city labels they provide and store them into a quadtree. Each node in the quadtree has 10 labels associated with it, starting with the largest population at the top of the data structure and going down. Based on the altitude we traverse a certain distance down the quadtree returning all cities from each node that corresponds to the tile requested.
Here is a video demonstrating how labels display with this new feature we’ve developed:
Future Plans
Currently, the entity creation is done on the frontend, but we are planning to move this to the backend sometime soon. There is also some crowding of the labels when zooming out since surface tiles aren’t immediately updated. The tiles can likely be filtered to remove unneeded ones more aggressively.
Running On Your System
We have released this code on our GitHub under the Apache license for everyone to use.
To get this up and running on your local system, start with a Git clone:
git clone https://github.com/EndPointCorp/tiled-city-labels.git
Then within the repo there’s a README to follow. We will give instructions here, but if they differ from the README follow those instead:
cd tiled-city-labels
docker build -t cesium-labels .
docker run -p 48088:48088 --rm cesium-labels
Then in a new terminal window still inside the project:
cd demo/
python -m SimpleHTTPServer 8000
Now you can navigate to http://localhost:8000/ in your browser and see the city labels up and running. To customize this to your own system, you can use the mixin demo/js/CitiesDataSource.js and add that to your own project. You can also change the port/server used in the mixin by editing the fetch command inside the queryData function.
visionport cesium gis open-source
Comments